« Proximate vs. Ultimate Causes | Main | Space and Time »
February 18, 2011
1000 Citations?
Today I'm going to admit something embarrassing, but something I suspect many academics do, especially now that it's so easy: I track my citation counts. It's always nice to see the numbers increase, but it also lets me keep up with which communities are reading my papers. Naturally, some papers do much better than others in picking up citations [1]. One that's been surprisingly successful is my paper with Cosma Shalizi and Mark Newman on power-law distributions in empirical data [2], which crossed 500 citations on Google Scholar earlier this year. Here's what the citation time series looks like [3]:
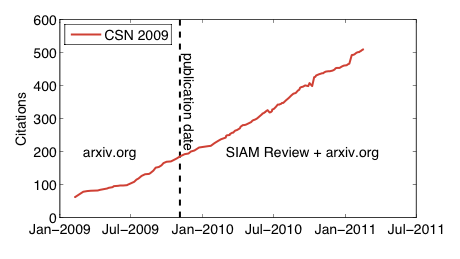
I've marked the online publication date (4 November 2009) in SIAM Review in the figure with the black dashed line. Notably, the trajectory seems completely unperturbed by this event, suggesting that perhaps most people who were finding the paper, were finding it through the arxiv, where it was posted in October 2007.
Given its already enormous citation count, with this data in hand, can we predict when it will pass the mind-boggling 1000 citation mark? The answer is yes, although we'll have to wait to see if the prediction is correct. [4]
Derek de Solla Price, the father of modern bibliometrics and the original discoverer of the preferential attachment mechanism for citation networks, tells us that the growth rate of citations is proportional to the number of citations a paper already has. Testing this assumption is trickier than it sounds. At the whole-citation-network level, the prediction of this assumption is a distribution of citations that has a power-law tail [5]. There have been a few attempts to test the microscopic assumption itself, again on a corpus of papers, and one of my favorites is in a 2005 paper in Physics Today by Sid Redner [6]. Redner analyzed 110 years of citation statistics from the Physical Review journals, and he calculated the attachment rates for groups of papers by first counting all the citations they received in some window of time [t,t+dt] and then counting the number of citations each of those papers received in a given subsequent year T. He then plotted the new citations in year T versus the total citations in the window, and observed that the function was remarkably linear, indicating that the proportional attachment assumption is actually pretty reasonable.
But, I haven't seen anyone try to test the proportional growth assumption on an individual paper, and perhaps for good reason. The model is grossly simplified: it ignores factors like the quality or importance of the paper, the fame of the authors, the fame of the journal, the influence of the peer review process, the paper’s topic, etc. In fact, the model ignores everything about the papers themselves except for its citation count. If we consider very many papers, it seems potentially plausible that these things should average out in some way. But for a single paper, surely these factors are important.
Maybe, but let's ignore them for now. For the CSN_2009 paper, let's mimic what Redner did to estimate the attachment rate: we choose some window length dt, divide up the 739 days of data into blocks each of dt days, and plot the number of citations at the beginning of a window versus the number of new citations the paper acquires over the next dt days. Here's the result, for a window length of 20 days:
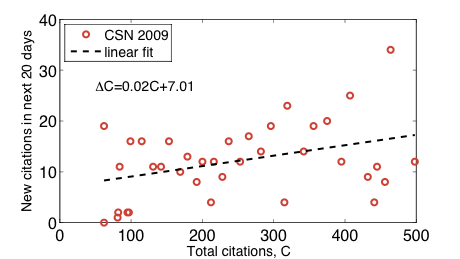
along with a simple linear fit to the scatter. Surprisingly, the positive slope suggests that the citation rate has indeed been increasing (roughly linearly) with total citation count, which in turn suggests that proportional growth is potentially a reasonable model of the citation history of this one specific paper. It also suggests that people are citing our paper not because it's a good paper, but because it's a highly cited paper. After all, proportional growth is a model of popularity not quality. (Actually, the very small value of the coefficient suggests that this might be a spurious result; see [7] below.)
This linear fit to the attachment rates is, effectively, a parametric proportional growth model, i.e., the coefficients allow us to estimate the number of new citations the paper will acquire in the next 20 days, as a function of the current citation count. Integrating this attachment rate over time allows us to make a projection of the paper's citation trajectory, which allows us to predict the date at which the paper will cross 1000 citations. Since the window size dt is an arbitrary parameter, and it's not at all clear how to choose the best value for it, instead we'll just make a set of projections, one for each value of dt. Here's the result:
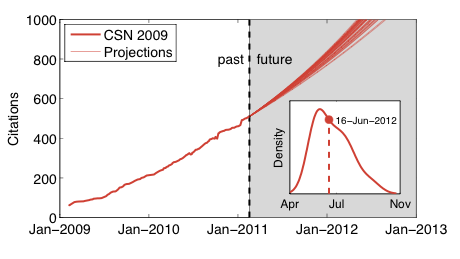
with the inset showing the smoothed distribution of predicted dates that the citation count will cross 1000. All of the predicted crossing dates fall in 2012, but vary based on the different fitted attachment rate models. The median date is 16 June 2012, which is slightly later than the mode at 29 May (this seems reasonable given the non-linear nature of the growth model); the 5 and 95% quantiles are at 1 May and 31 August.
So, there you have it, a prediction that CSN_2009 will cross 1000 citations in 14-18 months, and most likely in 15-16 months. [7] If I'm right, someone want to buy me a beer (or maybe a mug) to celebrate?
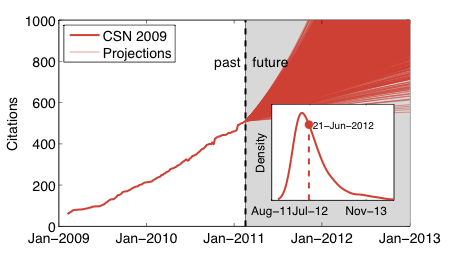
Update 18 Feb. 2011: After some gentle nudging from Cosma, I ran a simulation that better handles the uncertainty in estimating the attachment model; the improvement was to bootstrap the measured attachment rates before fitting the model, and then use that larger set of estimates to generate the distribution of crossing dates. Below is the result. The difference in the envelope of projections is noticeable, with a much wider range of crossing times for 1000 citations (a few trajectories never cross 1000), but the overprinting is deceptive. The inset shows that the distribution is mainly just wider. Comfortably, the middle of the distribution is about where it was before, with the median prediction at 12 June 2012 and the mode at 21 April 2012. The variance, as expected, is much larger, with the 5-95% quantiles now ranging from 11 Jan. 2012 all the way to 29 Nov. 2013.
-----
[1] One reason to distrust raw citation counts is that a citation doesn't provide any context for how people cite the paper. Some contexts include "everyone else cites this paper and so are we", "this is background material actually relevant to our paper", "this paper is wrong, wrong, wrong", "studies exist", "this paper mentions, in a footnote, something we care about", "we've read this paper, thought about it deeply and are genuinely influenced by it", among many others.
[2] It's hard not to be pleased with this, although there is still work to be done in fixing the power-law literature: I still regularly see new articles on the arxiv or in print claiming to see power-law distributions in some empirical data and using linear-regression to support the claim, or using maximum likelihood to estimate the exponent but not calculating a p-value or doing the likelihood ratio test.
[3] I started tracking this data via Google Scholar about two years ago, so I'm missing the earlier part of the time series. Unfortunately, Google Scholar does not allow you to recover the lost data. In principle other citation services like ISI Web of Science would, since every publication they track includes its pub date. There are also other differences. Google Scholar tends to pick up peer-reviewed conference publications (important in computer science) while ISI Web of Science tracks only journals (and not even all of them, although it does get very many). Google Scholar also picks up other types of "publications" that ISI omits, including tech reports, pre-prints, etc., which some people think shouldn't count. And, sometimes Google Scholar takes citations away, perhaps because it can't find the citing document anymore or because the Google Scholar team has tweaked their algorithms. In the time series above, you can spot these dips, which would not appear in the corresponding ISI time series.
[4] "It's hard to make predictions, especially about the future," a saying attributed to many people, including Yogi Berra, Niels Bohr and Mark Twain.
[5] In fact, the precise form of the distribution is known. For Price's original model, which includes the more recent Barabasi-Albert model as a special case, the distribution follows the ratio of two Beta functions, and is known as the Yule-Simon distribution. This distribution has a power-law tail, and is named after Udny Yule and Herbert Simon, whose interest in preferential attachment predated Price's own interest, even though they weren't thinking about citations or networks. I believe Simon was the first to derive the limiting distribution exactly for the general model, in 1955. If you're interested in the history, math or data, I gave a lecture on this topic last semester in my topics course.
[6] S. Redner, "Citation Statistics from 110 years of Physical Review" Physics Today 58, 49 (2005).
[7] There are other ways we could arrive at a prediction, and better ways to handle the uncertainty in the modeling. For instance, none of the projections accounted for uncertainty in the parameters estimated from the attachment rate data, and including that uncertainty would lead to a distribution of predictions for a particular projection. Doing the same trick with the window length would probably lead to higher variance in the distribution of prediction dates, and might even shift the median date. (Computing the distribution of predicted dates over the different window lengths does account for some amount of the uncertainty, but not all of it.)
Another possibility is to be completely non-parametric about the attachment function's form, although additional questions would need to be answered about how to do a principled extrapolation of the attachment function into the unobserved citation count region.
Still another way would be to dispense with the proportional growth model completely and instead consider something like the daily attachment rate, projected forward in time. Surprisingly, this technique yields a similar prediction to the proportional growth model, probably because the non-linearity in the growth rate is relatively modest, so these models would only diverge on long time scales. This fact is a little bit like a model-comparison test, and suggests that at this point, it's unclear whether proportional growth is actually the better model of this paper's citation trajectory.
posted February 18, 2011 08:35 AM in Self Referential | permalink
Comments
I already owe you a mug. :)
I'm still waiting for my first 100-citation paper, though that should actually happen reasonably soon (using google.scholar).
Posted by: Mason Porter at February 19, 2011 05:27 AM
From my personal experience, it really helps to co-author with famous people. And to be lucky. There's probably also some value in publishing in high-profile places, in active or growing communities and, of course, for being first, or at least early, in a field (even if you're wrong). Sadly, I think the hardest way to get cited a lot is to do steady, careful, serious, thoughtful work.
Posted by: Aaron at February 19, 2011 02:25 PM
It is possible to be first and also to do careful (etc) work. One of the laudable goals of being first and putting something relatively small out there is so people are aware that this is something they should study that they might not have realized is the case or might not have realized how to go about doing it. Part of being thoughtful is certainly realizing that one does not have a monopoly on how to go about a problem and therefore to lay things out in the open.
I think luck is really the key. Strictly speaking, I have coauthored with famous people and done all the other stuff as well (including getting into some of the sexy journals, though I refuse to compromise on the quality of the science or the paper in order to do so, which of course means I get in there less often than others do). The people who are paying attention are well aware of not just flashy work but also solid and steady work. A key question, of course, is just how many people are truly paying attention.
Posted by: Mason Porter at February 20, 2011 05:40 AM
Yeah, the size of the community is key. My best cited papers are in large and growing communities (statistical physics, networks and complex systems), while some of my favorite papers are in, apparently, much smaller or less active communities. Or, maybe those papers are just such odd-balls relative to those communities' norms that they don't persuade many people that they're valuable and/or worth extending. (I suspect this for my papers on terrorism and macroevolution...)
Posted by: Aaron at February 20, 2011 07:49 AM
I asked my student working on terrorist networks to take a look at your papers. :) [Actually, his report is due in about 3 weeks, so I'll definitely want your feedback on what we have so far. I'll send that to you once he's done.]
My own favorite papers are spread across the various areas in which I work, and there is little correlation between such thoughts and the citations I am getting. (Some of my papers that are decently cited or will become so are among my favorites, but others will hardly ever get any citations. And the subject area is indeed the biggest difference to be discerned among those papers.) I have talked to older scientists and the papers for which they are best known offer bear little resemblance to which of their papers they think has their best work. So I think we will need to get used to it. :)
Anyway, at least my first paper that will cross the 100 barrier is one of my genuine favorites (because I feel the paper makes a very difficult and nuanced thing understandable to lots of people).
Posted by: Mason Porter at February 20, 2011 10:12 AM