« Oops, I tweeted again | Main | Things to read while the simulator runs (higher ed. edition) »
March 30, 2012
Visualizing the ocean and the wind
Last week while I was in Germany at the DPG 2012, I noticed some buzz about a cool visualization of wind flows over the United States. The web animation, put together by Fernanda Viégas and Martin Wattenberg (who lead Google's "Big Picture" visualization research group) pulls surface wind speed and direction forecast data directly from the big NOAA's National Digital Forecast Database. While it's not direct measurements, I expect that the National Weather Service forecasts are pretty close to what actually happens. These wind patterns are a mesmerizing example of fluid turbulence.
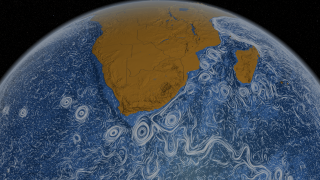
Another beautiful example of global turbulence comes from a recent global visualization of the world's ocean's surface currents (here's a popular description), put together by NASA using three years of satellite and other data. These empirical measurements were used to parameterize a detailed ocean dynamics simulation called MIT General Circulation Model. The output of the model is a visualization that looks a lot like van Gogh's Starry Night, with whorls and vortices abounding.

One cool thing is the scale of the coherent flows. We've all seen pictures of vortices in fluids, but typically these are somewhere between a few millimeters to a few meters in size. But, like a truly turbulent system, ocean currents exhibit structure at all scales, and that means vortices up to hundreds of miles across, in addition to all the small scale structure we normally think about. These are so big that you wouldn't know you were in a whirlpool because the curvature of the flow is so gentle that it would just feel like a regular current. Other cool things include the vortex shedding around South Africa, which persist well out into the Atlantic Ocean, thousands of miles away.
The wind visualization uses almost real-time model-based forecasts, but the ocean visualization is reconstructed from historical data. It would be especially cool if the latter could also be done in near real time. I can't think of a practical benefit for it (well, maybe container ships or pirates would like to know), but it would be cool.
posted March 30, 2012 05:47 PM in Pleasant Diversions | permalink
Comments
Fundamentally, I choose research projects precisely because I think they're interesting. Having applications is great and even desirably, but fundamentally the point is to ask Why?, How?, and occasionally perhaps even Why not? (says the guy with a paper with a model for synchronization of cows).
P.S. There might be an MGP rough draft in April. I'll keep you posted.
Posted by: Mason Porter at March 30, 2012 07:23 PM
Great article, i liked this visualization and specially i go deep into vortex shedding in South Africa,and some other places.
Posted by: Saso Gjorevski at April 4, 2012 04:35 AM